
Toll Road News Analysis, October 2026: Data from 4,287 Stories
Qola dashboard data from 4,287 online news stories: daily trend, sentiment, top outlets, and the incidents behind spikes in negative toll road coverage.
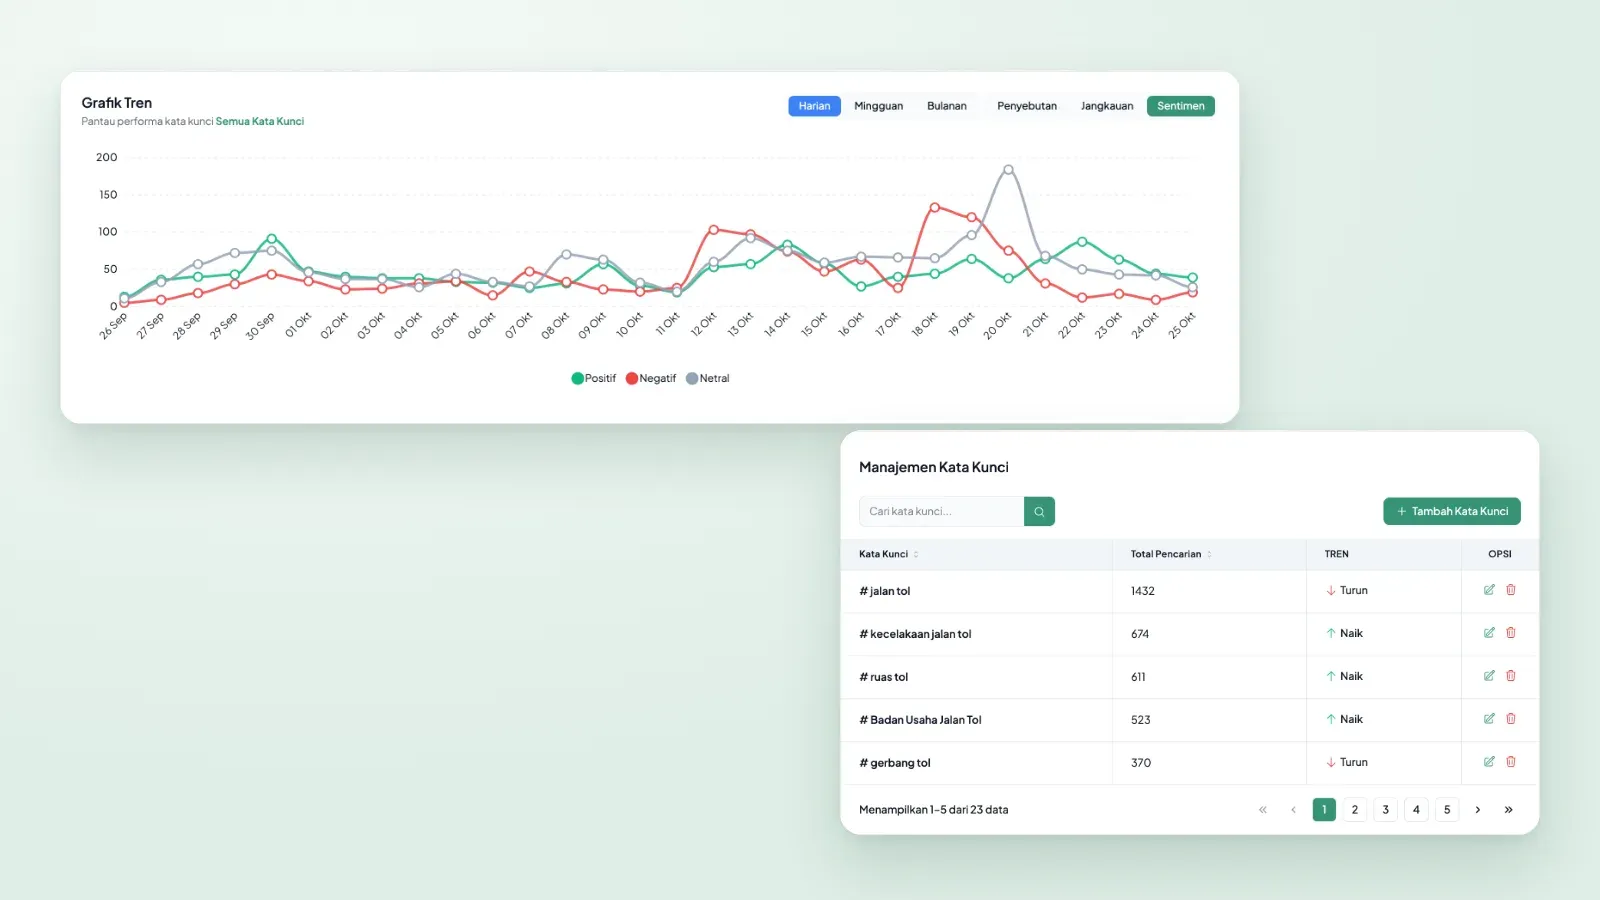
Between 26 September and 25 October 2026, the Qola dashboard recorded 4,287 online news stories about Indonesia's toll roads from 1,138 outlets, with sentiment split 39% neutral, 32% positive, and 29% negative. The biggest spikes in negative coverage were not driven by tariffs or operators, but by incidents: an attack on a team bus at a rest area, fatal crashes, and smoke from a fire drifting across a toll road.
This article breaks the data down directly from the Qola dashboard: the daily trend, the peak days and what caused them, the keywords with the most negative sentiment, the outlets that published the most, and notes on methodology. Every image below is a screenshot of the dashboard filtered to news sources.
The 30-day numbers at a glance
The data comes from a single toll-road monitoring project in Qola with 23 keywords, including toll road, toll section, toll gate, rest area, toll tariff, and toll road accident (all tracked in Bahasa Indonesia). Sources are limited to national and regional online news. Sentiment is labelled automatically by AI based on each story's content.
|
Metric |
Value |
Note |
|---|---|---|
|
News stories |
4,287 |
Each URL counted once |
|
Outlets |
1,138 |
National and regional |
|
Neutral sentiment |
1,676 (39%) |
Traffic updates, section information, announcements |
|
Positive sentiment |
1,372 (32%) |
New sections opening, services, construction |
|
Negative sentiment |
1,239 (29%) |
Crashes, crime, travel disruption |
|
Busiest day |
20 October (297 stories) |
Protests in Jakarta and a pile-up on the Ancol toll road |
Daily trend: volume doubled in the second half of October
In the first two weeks, most days carried between 80 and 145 stories, with one peak on 30 September. From 12 October, volume jumped and stayed high until 20 October.

Counted in seven-day blocks, coverage moved from 803 stories (26 September to 2 October) and 761 (3 to 9 October) to 1,159 (10 to 16 October) and 1,385 (17 to 23 October). The rise was not caused by one big story, but by several incidents happening close together, each reported over several days.
Four moments that moved the coverage
The daily sentiment chart shows the pattern more clearly. The negative line spiked twice, on 12 to 13 October and 18 to 19 October, while the 20 October peak was dominated by neutral stories.

|
Date |
Stories |
Dominant sentiment |
Main trigger |
|---|---|---|---|
|
30 September |
209 |
Positive (91) |
A new toll section opening in East Java |
|
12 October |
216 |
Negative (103) |
An attack on a football team bus at a rest area |
|
18 October |
242 |
Negative (133) |
A crash involving travelling fans and smoke from a fire |
|
20 October |
297 |
Neutral (184) |
Traffic diversions during protests and a pile-up |
1. A new section opens and positive sentiment rises
The first peak came when the Gending to Paiton section of the Probolinggo-Banyuwangi toll road opened (in Indonesian) with two weeks of free travel. On the same day, a truck drivers' protest in Surabaya briefly blocked a toll exit, so negative stories also rose even though positive ones stayed dominant.
2. A rest area incident dominates negative sentiment
On 12 October, negative stories reached 103 in a single day. The trigger was an attack on an under-18 team bus at a rest area on the Batang toll road (in Indonesian). The story ran for a week, from the arrests to the football federation's response. It had nothing to do with the toll road's services, yet the rest area and toll section kept appearing in headlines.
3. A crash and fire smoke extend the negative trend
The second negative spike came on 18 and 19 October, with two stories running side by side: a crash on the Madiun toll road that killed four travelling fans, and smoke from a landfill fire covering the Bakauheni-Terbanggi Besar toll road in Lampung (both in Indonesian).
4. The busiest day was mostly neutral
The highest volume came on 20 October, but 184 of the 297 stories were neutral. Many were traffic diversion notices and road condition updates during protests in Jakarta. On the same day, a pile-up on the Ancol toll road (in Indonesian) added to the negative count.
Keywords with the most negative sentiment
The keyword table in the dashboard shows how many stories contain each keyword. One story can contain several keywords, so the figures in this table add up to more than the total number of stories.

To compare sentiment, we grouped each story by its main keyword. Stories under rest area and toll road accident were both 58% negative. In contrast, stories under toll road business entity were 53% positive, as many covered construction and services. Stories about toll tariffs were mostly neutral (54%), usually reporting the new rates.

Every story in the dashboard appears with its sentiment label, keyword, outlet influence score, and publication time, so the team can open the original source straight away. How automatic labels like these work, and where they fall short, is covered in the challenges of sentiment analysis in Bahasa Indonesia.
The outlets that published the most
Detik.com published the most stories (145, plus 59 on news.detik.com), followed by rri.co.id (71) and inews.id (69). Regional outlets such as jambiekspres.disway.id also made the top ten.

More importantly, the top ten outlets account for only 674 stories, around 16% of the total. The other 84% are spread across more than a thousand other outlets, most of them regional. For communications teams, watching only a handful of national outlets would miss most of the coverage, especially incident stories that often break first in local media.
AI summary from the dashboard
Besides the numbers, Qola writes topic summaries automatically. The example below is the daily summary for 25 October 2026: crashes were the largest topic with negative sentiment, while toll construction and new toll gates were positive.

Summaries like this help teams write a morning brief without reading hundreds of stories one by one. The structure can feed straight into a media monitoring report for leadership.
Methodology notes and limitations
Three things are worth knowing before quoting the figures above. First, sentiment labels come from AI and still need checking. For example, one story about an overloaded pickup overturning on the Sidoarjo toll road (in Indonesian) was labelled positive when it should have been neutral or negative.
Second, broad keywords pick up irrelevant stories, such as used-car price articles that mention toll roads in passing. Boolean queries with exclusions (NOT) can narrow them. Third, 408 headlines appear more than once because the same story was republished by several portals. The figure of 4,287 counts every URL, not every event.
Lessons for toll road operators and stakeholders
The data shows that a toll section's reputation can be pulled down by events unrelated to its services. Four practical steps follow:
- Separate facility keywords, such as rest areas and toll gates, from institutional keywords, so incident-driven spikes are visible apart from service issues.
- Prepare holding statements for recurring incidents, such as crashes, fires near a section, or security problems at rest areas.
- Watch daily spikes, not just monthly totals. The spikes on 12 and 18 October are obvious in the daily chart but disappear in a monthly figure. The crisis communication early warning guide covers when a spike needs escalation.
- Compare with other periods and other organisations using the same rules, for example by calculating share of voice.
An analysis like this can be produced for any issue you monitor. Qola collects national and regional news, labels sentiment in Bahasa Indonesia, and prepares daily summaries. See how Qola works for SOEs and corporations and government agencies, or contact the Qola team to try it with your own keywords.
All images are screenshots of the Qola dashboard (Indonesian interface) filtered to news sources, covering 26 September to 25 October 2026 and captured on 26 October 2026. Figures may shift slightly as new stories arrive and sentiment labels are corrected.
FAQ: toll road news analysis
Where does the data in this analysis come from?
From a toll-road monitoring project in the Qola dashboard, using national and regional online news. The period runs from 26 September to 25 October 2026, with 23 toll-related keywords.
Does negative sentiment mean toll road services are poor?
Not necessarily. Sentiment reflects the overall tone of a story. In this period, most negative stories covered crashes and crime that happened on toll roads, not complaints about operators' services.
Why do the keyword figures add up to more than the total stories?
Because one story can contain several keywords, such as toll road and rest area together. The keyword table counts every match, while the story total counts each URL once.
Can a similar analysis be made for my organisation's issues?
Yes. Choose the keywords, media sources, and period you want to monitor, and the dashboard will show the same trends, sentiment, outlets, and summaries. The Qola team can help set up the initial keywords.