
How to Read Regional News Coverage: Province-Level Data Examples
A guide to reading the regional spread of news with data from 2,254 articles: two province rankings, finding triggers by district, dominant outlets, acute vs chronic issues, and who responds.
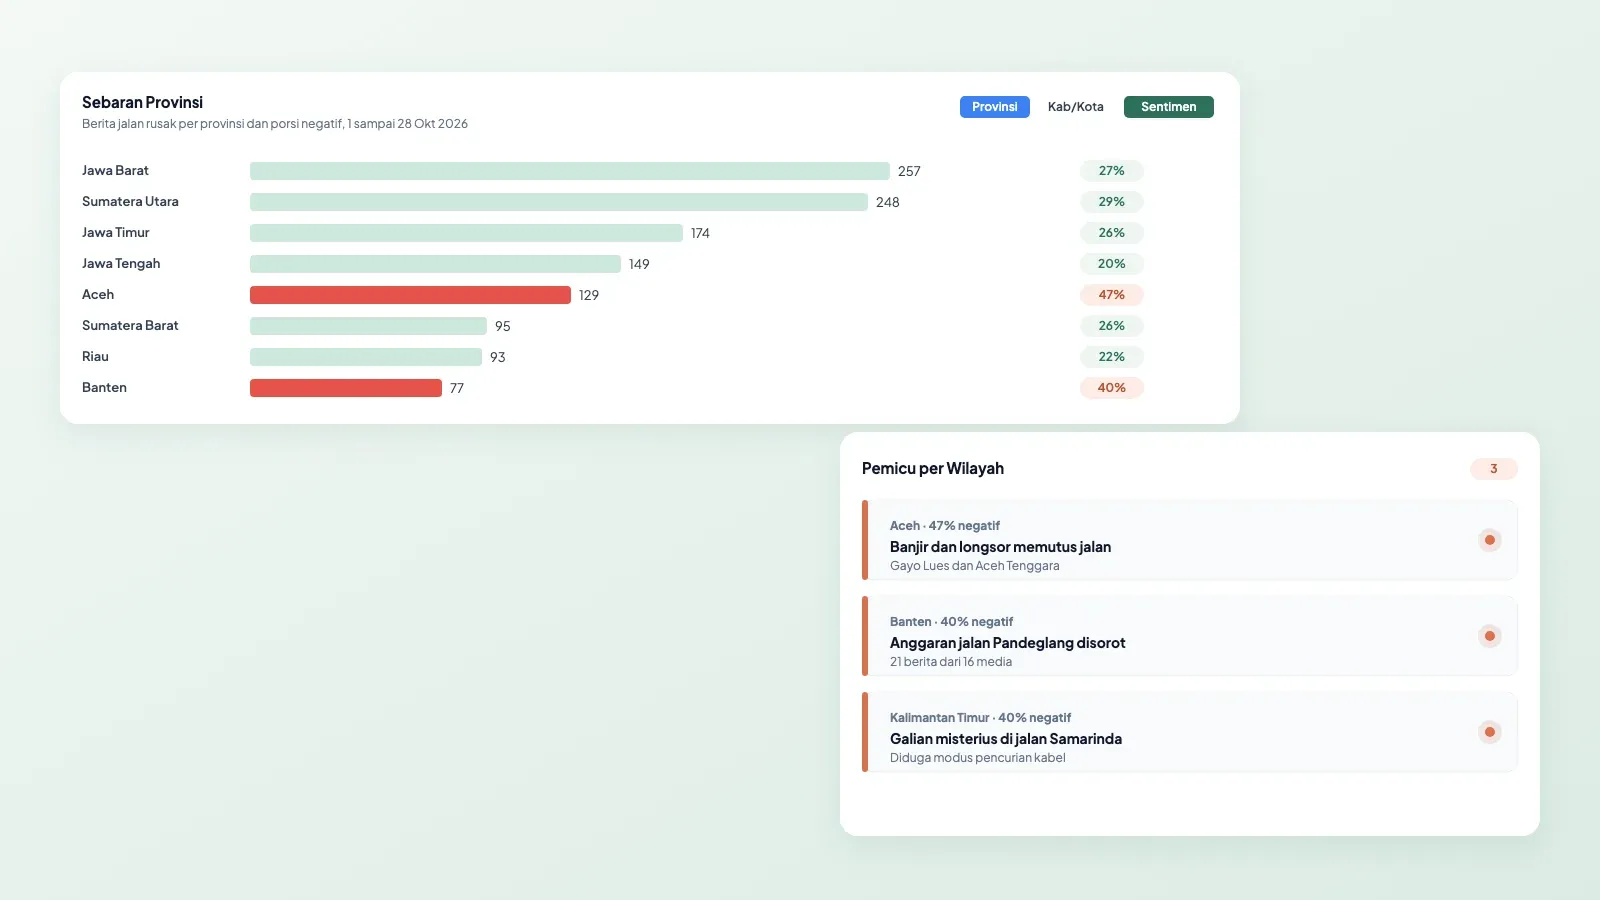
Reading the regional spread of news coverage means not stopping at the province with the most articles. Compare the number of negative articles with their share, drill down to districts and cities to find the trigger, check whether one outlet dominates, and use the weekly pattern to tell whether an issue is acute or chronic. The most covered province is not always the most troubled one, and the most serious issue can come from a region with a moderate number of articles.
This guide uses real data from the October 2026 road damage news report: 2,254 Indonesian online news articles from 1 to 28 October 2026. It complements how to read news spikes. Spikes answer when an issue grows; regional spread answers where.
Why regional spread matters
Many public issues in Indonesia are local: damaged roads, floods, health services, school fees. National totals hide all of them. One subdistrict can be full of complaints while the provincial total looks ordinary.
For government communication teams, region also decides who has to respond. National roads are the responsibility of the Ministry of Public Works, provincial roads belong to the provincial government, and district roads to the district government. Misreading the region means sending the response to the wrong office.
Step 1: Map articles to regions, and acknowledge what cannot be mapped
Articles are mapped from province, district, or city names in the headline, then from locations recognized by AI in the body. In the October data, 1,858 of 2,254 articles (82%) could be mapped to one province. The remaining 396 (18%) did not name a clear region, such as national policy stories or expert explanations.
There are two traps at this step:
- Place names that are also common words or used in two places. "Batu", "Pati", "Bone", and "Puncak" are district or city names in Indonesia, but also everyday words. In the October data, a motorcycle review mentioning damaged roads at "Puncak 2 Jonggol" in Bogor, West Java, was briefly mapped to Central Papua because a Puncak district exists there. Names like these should only count when preceded by "Kabupaten" (district) or "Kota" (city), or be checked by hand.
- Articles without a place name in the headline. Of 129 articles about Aceh, 55 did not name a district or city in the headline. Their mapping depends on the article body, so they need a second check before being used for decisions.
Step 2: Do not stop at the article count ranking
An article count ranking reflects two things at once: the size of the issue and the number of outlets in the region. West Java ranked first with 257 articles, but those came from 146 outlets. Provinces with many local outlets almost always top the ranking, whatever the issue.
So build two rankings: the number of negative articles and the share of negative articles. They tell different stories.

|
Province |
Articles |
Negative articles |
Negative share |
|---|---|---|---|
|
North Sumatra |
248 |
73 |
29% |
|
West Java |
257 |
70 |
27% |
|
Aceh |
129 |
60 |
47% |
|
Banten |
77 |
31 |
40% |
|
East Kalimantan |
57 |
23 |
40% |
|
Riau Islands |
46 |
3 |
7% |
North Sumatra and West Java had the most negative articles, but their share was close to the national average. Aceh, Banten, and East Kalimantan were smaller, yet 40% or more of their articles were negative. In regions like these, almost every time road issues make the news, the tone is bad. The Riau Islands, by contrast, were almost entirely positive or neutral. Only compare negative shares between regions with enough articles, for example at least 40. With 5 articles, a single negative one already means 20%.
Step 3: Drill down to districts and cities to find the trigger
Provincial numbers only show where to look. The trigger becomes visible at the district, city, or road level. The three provinces with the highest negative share in October had very different triggers:
|
Province |
Main trigger |
Data |
|---|---|---|
|
Aceh (47% negative) |
Floods and landslides cutting national and provincial roads, especially in Gayo Lues and Southeast Aceh |
49 of 129 articles covered floods, landslides, or cut roads; 29 named Gayo Lues or Southeast Aceh, 19 of them negative |
|
Banten (40% negative) |
Damaged roads in Pandeglang, including criticism comparing the road repair budget with the travel budget of local legislators |
21 articles from 16 outlets named Pandeglang, 10 of them negative |
|
East Kalimantan (40% negative) |
Dozens of mystery digs in Samarinda roads, suspected to be a cable theft scheme, plus calls to repair the national road to West Kutai |
16 articles from 14 outlets named Samarinda, 12 of them negative |
All three need a different response. Aceh is about disaster preparedness and restoring national roads. Banten is about public trust in budget priorities. East Kalimantan is not even about road quality, but about security. Without drilling down, all three would be reported simply as "damaged roads".
Step 4: Check whether one outlet dominates
In regions with few outlets, one newsroom that covers a topic heavily can make an issue look bigger than actual public attention. Calculate the share of the top outlet in each region.
In West Java, the outlet with the most articles accounted for only 4% of all road damage articles in the province. In North Kalimantan, 36 articles came from 14 outlets, and a single outlet contributed 8 of them (22%). The North Kalimantan numbers still deserve attention, but they should be read as intensive coverage by one newsroom, not scrutiny from many outlets at once.
Step 5: Look at the weekly pattern: acute or chronic?
A monthly total hides the shape of an issue. Break it down by week to separate a short spike from a problem that persists.

- Acute: North Sumatra and West Java spiked in the third week (114 and 105 articles), driven by a national road collapse at Sipirok and the Ciamis damaged road controversy, then returned to around 50 articles a week. Acute issues need a fast response and usually fade once handled.
- Chronic: Aceh stayed between 27 and 34 articles every week, with nearly half negative. No spike triggered an alert, but complaints never stopped. Chronic issues are often missed by systems that only look for spikes.
- Driven by a press release: The Riau Islands rose from 1 article in the second week to 25 in the third. Ten of those were one Batam authority press release about speeding up road repairs, carried by many outlets.
- New region: Mimika district only appeared in the third and fourth weeks, mostly about repairs to Jalan Hasanuddin after residents complained. A region that suddenly appears is worth checking, because it may be the start of a new issue.
Step 6: Decide who should respond
Once you know the region and the trigger, decide who owns the response. For road issues, the road's status determines the responsible office:
|
What you see |
What it means |
Action |
|---|---|---|
|
High count, average negative share |
A region with many outlets, an ordinary issue |
Monitor routinely. Focus on districts that stand out. |
|
Moderate count, negative share of 40% or more |
A serious issue in a specific region |
Drill down to districts and roads. Make sure the responsible office knows and is ready to respond. |
|
Steady every week, high negative share |
A chronic problem |
Add it to regular leadership reports and the repair plan, not just the media response. |
|
One outlet dominates |
Intensive coverage by one newsroom |
Build a relationship with that newsroom. Provide data and sources. |
|
A new region appears |
Possibly the start of a new issue |
Check the trigger the same day before it spreads to other outlets. |
How to turn these findings into a one-page report leaders actually read is covered in the media monitoring report for leadership. To manage chronic issues over the long term, see issue management.
Common mistakes when reading regional spread
- Treating article count as the size of the problem. Article count measures media attention, not the length of damaged road or the number of residents affected.
- Comparing shares from very small counts. A negative share from 5 articles cannot be compared with one from 250.
- Ignoring unmapped articles. 18% of October's articles had no region. If that share is large, regional conclusions can be biased.
- Trusting automatic mapping completely. Ambiguous place names, like the Puncak example above, need a manual check.
- Looking at a month without the weekly pattern. Acute and chronic issues can have the same total but need different responses.
Reading regional spread in the Qola dashboard
In Qola, national and regional online news is mapped by region and labeled for sentiment in the context of Bahasa Indonesia, so the number and share of negative coverage per region can be compared in one view. Spikes in negative mentions and new regions are flagged as anomalies, and the articles behind them can be opened directly to find the trigger. Regional monitoring needs for government institutions are covered in media monitoring for government institutions.
See solutions for government PR, or contact us to see how issues spread across your region.
Data: Qola analysis of national and regional Indonesian online news for the keywords "kondisi jalan" (road condition) and "kerusakan jalan" (road damage), 1 to 28 October 2026 (Western Indonesia Time), after filtering. Regions are mapped from place names in headlines and locations recognized by AI. Sentiment labeled automatically by Qola AI. You may cite this data with Qola (qola.id) as the source.
FAQ: reading regional news coverage
What is the regional spread of news coverage?
It is the breakdown of articles about an issue by the province, district, or city they cover. It shows where an issue is most discussed and most negative, and which office is responsible for responding.
How do you map news articles to provinces?
Articles are mapped from province, district, or city names in the headline, then from locations mentioned in the body. Place names that are also common words, such as Batu or Puncak, should only count when preceded by "Kabupaten" or "Kota".
Which matters more, the number of negative articles or the negative share?
Both. The number of negative articles shows the response workload, while the negative share shows how bad the tone is in a region. In the October 2026 road damage data, North Sumatra had the most negative articles (73), while Aceh had the highest negative share (47%).
How do you tell an acute issue from a chronic one?
Break the article count down by week. An acute issue spikes sharply in one week and then falls, like North Sumatra and West Java in the third week of October 2026. A chronic issue stays steady every week with a high negative share, like Aceh.
What share of articles usually cannot be mapped to a region?
It depends on the issue. In the October 2026 road damage data, 18% of articles did not name a clear region. National policy issues usually have a larger unmapped share than local issues such as damaged roads.