
How to Read News Spikes: 6 Steps with Real Data
A guide to reading news spikes with real data from 2,254 articles: normal patterns, spike ratios, negative spikes, finding the trigger, silent spikes, and when to escalate.
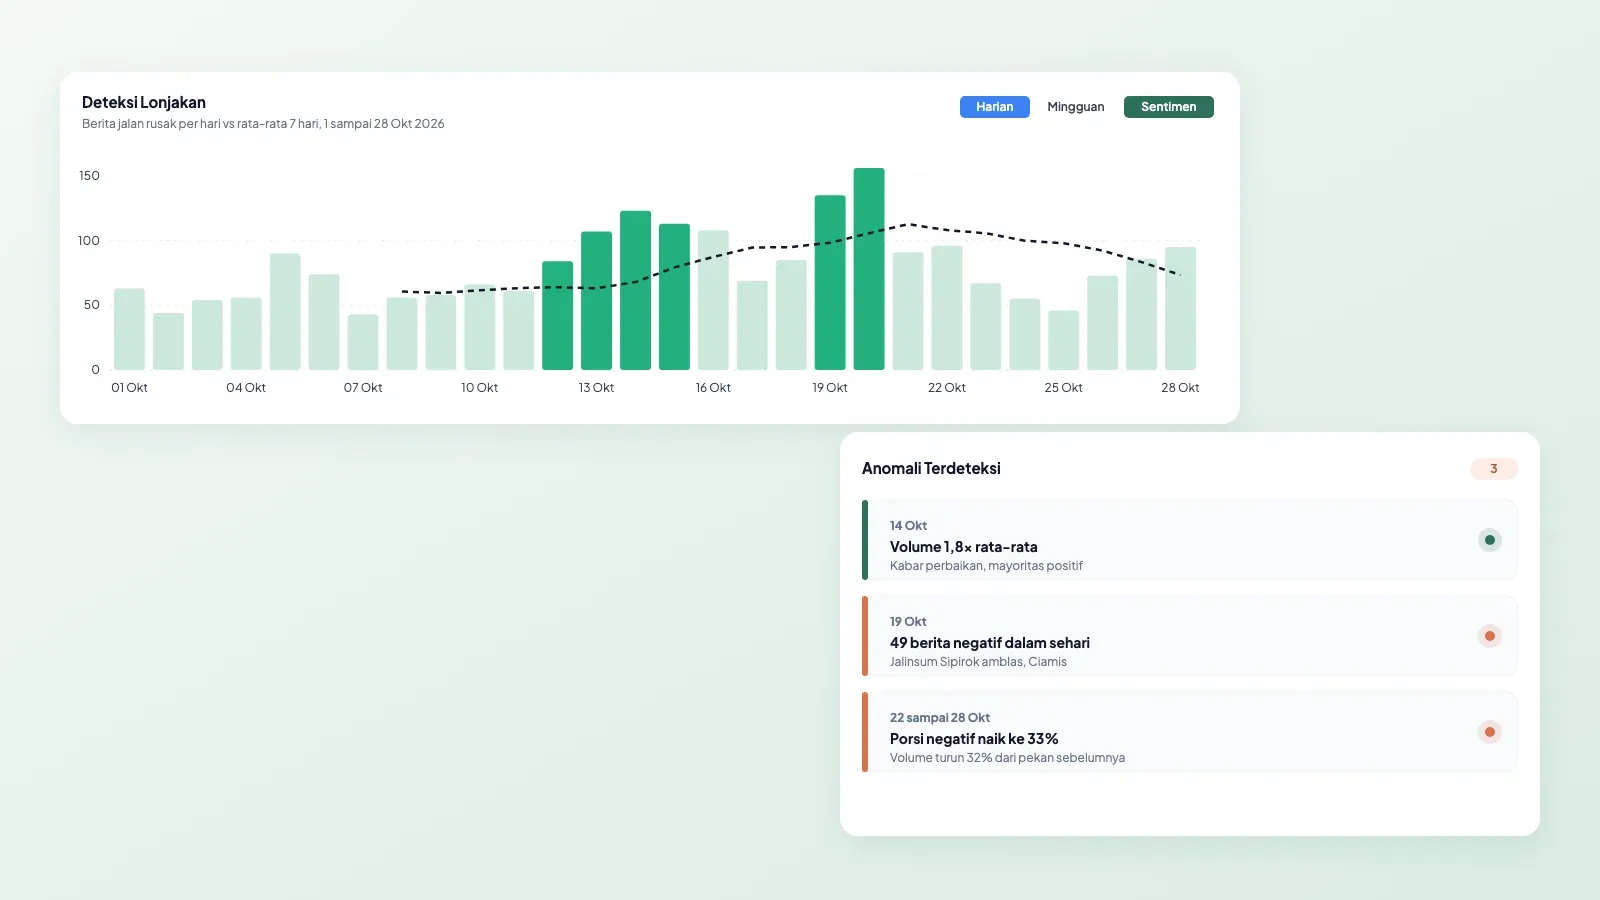
A news spike is a rise in coverage far above an issue's usual pattern within a short time. To read one, compare today's count with the average of the previous seven days, separate a volume spike from a spike in negative coverage, open the articles to find the trigger, and then decide whether a response is needed. The day with the most articles is not always the spike that matters most, and an issue can get worse while the number of articles is falling.
This guide uses real data: 2,254 Indonesian online news articles about damaged roads from 1 to 28 October 2026, collected by Qola for the October 2026 road damage news report. Each step shows what the data reveals, and what you would miss by looking at totals only.
What is a news spike?
A spike is a rise in mentions far above an issue's normal pattern within a short time, usually hours or days. The key phrase is normal pattern. An issue that usually gets 60 articles a day and suddenly gets 120 is spiking. An issue that gets 300 articles every day and rises to 330 may not be.
Not every spike is dangerous. Spikes can come from good news, such as a launch or a repair program reported by many outlets at once. Still, every spike is worth checking for its trigger, because that is where the first signs of a crisis usually appear. The term is also explained in the Qola glossary.
Step 1: Know the normal pattern before looking for the abnormal
Before calling a day a spike, know what an ordinary day looks like. News coverage has a weekly rhythm. In the October 2026 road damage data, weekdays were much busier than weekends:
|
Day |
Average articles per day |
|---|---|
|
Monday |
95.5 |
|
Tuesday |
105.8 |
|
Wednesday |
88.0 |
|
Thursday |
82.0 |
|
Friday |
69.2 |
|
Saturday |
61.0 |
|
Sunday |
62.0 |
Tuesdays averaged 73% more articles than Saturdays. A Monday with 90 articles may be an ordinary day, while a Saturday with 90 deserves a closer look. Comparing Monday with the previous Sunday will always look like a spike, even though it only reflects newsroom rhythm.
The simplest way to set the normal pattern is the average of the previous seven days. A seven-day window always covers one full cycle of weekdays and weekend, so the weekly rhythm does not distort the comparison.
Step 2: Measure with a ratio, not with the highest number
Divide today's article count by the average of the previous seven days. The result is the spike ratio. A ratio of 1.0 is normal. A ratio of 1.5 means 50% above usual.

The October data shows why a ratio is more honest than raw numbers. The day with the most articles was 20 October, with 156. But the previous week's average was already high (105.7), so the ratio was 1.5. The sharpest spike came on 14 October: 123 articles, or 1.8 times the previous seven-day average (67.9). That day does not stand out if you only look for the highest number, yet it is when coverage first rose above the early-month pattern.
|
Date |
Articles |
Previous 7-day average |
Ratio |
|---|---|---|---|
|
13 October |
107 |
63.1 |
1.7 |
|
14 October |
123 |
67.9 |
1.8 |
|
19 October |
135 |
98.4 |
1.4 |
|
20 October |
156 |
105.7 |
1.5 |
What threshold should you use? There is no fixed number. For a high-volume issue like this one, a ratio of 1.3 is worth checking, and a ratio of 2 or more almost always has a clear trigger. For low-volume issues, add a minimum count. A rise from 2 to 6 articles is a ratio of 3, but it may mean nothing.
Step 3: Separate volume spikes from negative spikes
A volume spike and a negative spike are different things, and you need to look at each one separately.
The spike on 13 and 14 October was mostly good news. Half of the headlines on 14 October were about road repairs, above the monthly average of 41%. Examples include Pekanbaru city government completing 32 kilometers of road repairs (11 articles from 10 outlets) and maintenance of the Toisapu–Amahori road in Ambon (7 articles from 6 outlets). A day earlier, the Ministry of Public Works' response to eight landslide points on the Tapan–Jambi border national road was carried by 10 outlets. Only 17% of articles on 13 October were negative, well below the monthly average of 28%.
The spike on 19 October was different. It had 135 articles, fewer than the peak the next day, but 49 of them were negative. That was the highest daily number of negative articles in the month. Three stories drove it at the same time:
- The Trans-Sumatra highway at Sipirok collapsed and was closed, with traffic diverted. 17 articles appeared that day alone.
- A North Sumatra provincial legislator urged repairs to the Silabah Jaya–Sipintuangin road. The statement was carried by 11 outlets on the same day, 9 of them negative.
- The Ciamis road damage episode returned after Cintajaya residents met the West Java governor, three days after the first video spread.
The lesson: a team that only waits for the day with the most articles will react a day late, and possibly to the wrong thing.
Step 4: Open the articles: one story or many?
Numbers do not explain the trigger. After finding a spike day, read the headlines and group them. The two most useful questions are how many outlets carried the same story, and whether the headlines are uniform or varied.
|
Pattern |
October 2026 example |
How to read it |
|---|---|---|
|
Republished press release |
One headline about the Batam authority speeding up road repairs appeared in 12 outlets from 19 to 22 October |
Near-identical headlines across outlets. A sign the press release was distributed well, not an issue growing on its own. |
|
Public figure's statement |
A North Sumatra legislator's call for repairs was carried by 11 outlets in one day |
One source, many outlets. Important if the figure is influential, but it usually fades in a day or two. |
|
Event |
The Trans-Sumatra highway collapse at Sipirok, 17 articles in one day |
Many outlets report on their own with different angles. Usually followed by stories about the response. |
|
Layered viral story |
Ciamis: the governor's video, then residents meeting the governor, then a budget plan |
Varied headlines arriving in waves. The riskiest pattern, because every new response can become a new story. |
The ratio of outlets to distinct headlines is a quick clue. Many outlets with few distinct headlines usually means a press release. Many outlets with many distinct headlines means newsrooms considered the story worth covering themselves.
Step 5: Watch for silent spikes
Not every problem arrives as a volume spike. Sometimes the number of articles falls while the tone gets worse.

In the fourth week (22 to 28 October), road damage coverage fell 32% from the week before, from 757 to 518 articles. Yet the share of negative articles rose from 24.6% to 33.0%, the highest of the month. No single big story was behind it. Instead, many small complaints appeared across many regions with one common thread: roads that had just been built or repaired were already damaged again. Headlines about project quality rose from 9 in the first two weeks to 29 in the last two, such as a concrete road that cracked a month after completion and a concrete road worth billions of rupiah that broke before it was finished.
A daily volume chart will not flag a pattern like this. Also track the weekly negative share and recurring themes, not just article counts.
Step 6: Decide on a response
Once you know the size, tone, and trigger of a spike, decide what to do. This simple matrix is a starting point:
|
What you see |
What it likely means |
Action |
|---|---|---|
|
Volume up, negative share normal or down |
Good news or a widely carried press release |
Record it as an achievement. Note which outlets carried it for the next distribution. |
|
Volume up, negative share up, one source |
A public figure's statement or a single incident |
Prepare data and an explanation. Watch whether other outlets start their own coverage. |
|
Volume up, negative share up, many angles |
The issue is growing |
Escalate to leadership the same day. Assign a spokesperson and prepare a statement. |
|
Volume down, negative share up |
Silent spike, scattered complaints |
Find the recurring theme and regions. Fix the cause, not just the coverage. |
Alert formats and escalation paths are covered in more detail in the crisis communication early warning guide. To place a spike within an issue's life cycle, see issue management.
Common mistakes when reading spikes
- Ambiguous keywords. The Indonesian word for road, "jalan", also appears in words and phrases about walking, street protests, and car reviews. Of 10,305 raw articles for the keywords "kondisi jalan" (road condition) and "kerusakan jalan" (road damage), only 2,254 were actually about damaged roads. Without filtering, a spike can come from unrelated news.
- Counting duplicates. The same headline on the same outlet, or one press release republished a dozen times, can make a small issue look big. Count distinct headlines too.
- Forgetting weekly rhythm and holidays. Mondays are almost always busier than Sundays. National holidays lower volume, so the next day looks like a spike.
- Looking only at national totals. Very local issues, such as damaged roads in one district, disappear in national numbers. Break them down by province or regency.
- Treating every spike as a crisis. The spike on 13 and 14 October was mostly good news. Overreacting to positive spikes wastes the team's time.
- Trusting automatic sentiment labels completely. AI labels help filter, but important decisions still need a human check. How they work is explained in sentiment analysis in Bahasa Indonesia.
Reading spikes in the Qola dashboard
You can do every step above by hand in a spreadsheet, but it takes time when done daily. In Qola, the daily trend is shown by sentiment, so volume spikes and negative spikes appear in one chart. Spikes in negative mentions and new regions are flagged as anomalies, and the articles behind them can be opened directly to find the trigger. The results can be turned into a report for leadership.
See solutions for government PR, or contact us to see spike patterns for your organization's issues.
Data: Qola analysis of national and regional Indonesian online news for the keywords "kondisi jalan" and "kerusakan jalan", 1 to 28 October 2026 (Western Indonesia Time), after filtering. Sentiment labeled automatically by Qola AI. You may cite this data with Qola (qola.id) as the source.
FAQ: reading news spikes
What is a news spike?
A news spike is a rise in the number of articles about an issue far above its normal pattern within a short time. The normal pattern is usually measured as the average of the previous seven days.
How do you calculate a news spike?
Divide today's article count by the average daily count over the previous seven days. A ratio of 1.0 is normal. For high-volume issues, a ratio of 1.3 or more is worth checking, and 2 or more almost always has a clear trigger.
Is the day with the most articles always the biggest spike?
No. In the October 2026 road damage data, the busiest day was 20 October (156 articles, ratio 1.5), but the sharpest spike was 14 October (123 articles, ratio 1.8), because the previous average was much lower.
What is a silent spike?
A silent spike is when the number of articles stays flat or falls, but the share of negative coverage rises. For example, in the fourth week of October 2026, road damage coverage fell 32% while the negative share rose from 24.6% to 33.0%.
When should a spike be escalated to leadership?
When volume and negative share rise together, and the same story is covered by many outlets from different angles. That signals a growing issue, not just a press release or a single statement being republished.