
Daily Media Monitoring Report: Example, Format, and Template
A one-page daily media monitoring report format, a filled-in example, a column template for the article list, and how to prepare it in 30 minutes each morning.
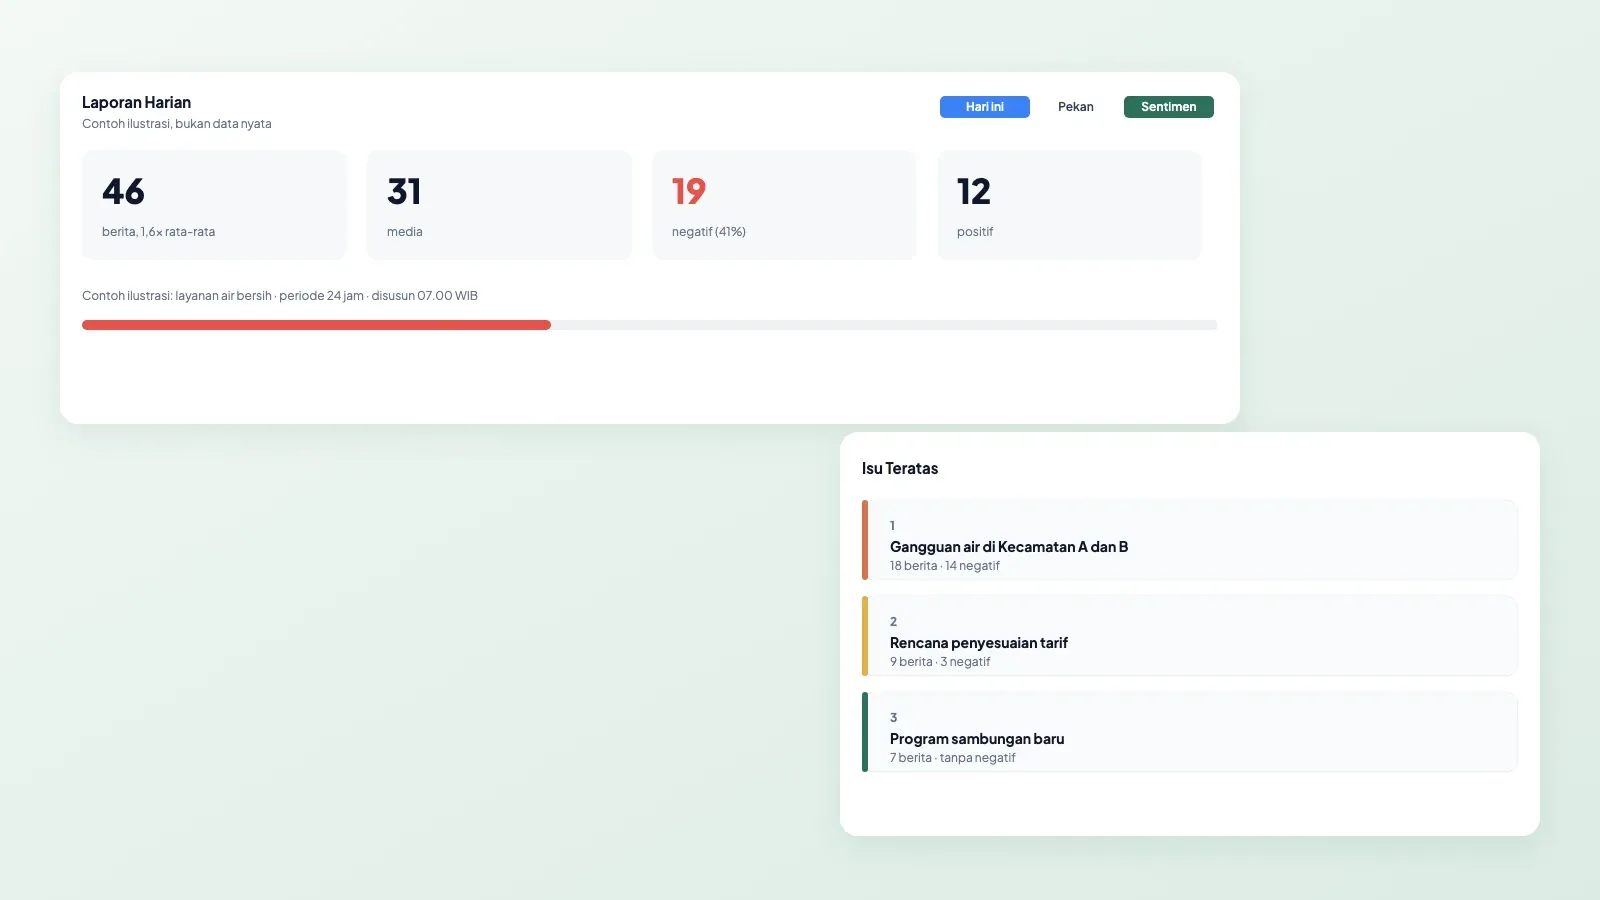
A daily media monitoring report is a one-page summary of the last 24 hours of coverage about an organization: how much, what tone, which issues stood out, where, and what needs to be done today. A good daily report can be read by leadership in two minutes and answers one question right away: is there anything we need to act on?
This article includes a daily report format, a filled-in example, a column template you can copy, and tips for preparing it every morning. For fuller weekly or monthly reports, see the media monitoring report for leadership.
Why a daily report differs from a monthly report
A monthly report answers "how was our image this month". A daily report answers "what do we need to do today". That is why a daily report must be short, focus on changes compared with a normal day, and always end with recommended actions.
|
Aspect |
Daily report |
Monthly report |
|---|---|---|
|
Readers |
Leadership and the PR team |
Leadership, related units, program evaluation |
|
Length |
One page |
Several pages with charts |
|
Focus |
New issues, spikes, negative articles that need a response |
Trends, comparisons, achievements |
|
When it is sent |
Every morning, before working hours |
Early the following month |
Daily media monitoring report format
- Header: issue or organization name, date, period (for example 07:00 yesterday to 07:00 today), and author.
- Three-sentence summary: the most important points today, written for leaders who only have time to read this part.
- Key numbers: number of articles and outlets, share of positive, neutral, and negative coverage, and a comparison with the previous seven-day average.
- Top issues: the three biggest issues, each with article count, tone, and a one-sentence explanation.
- Regions: the most covered or most negative regions, if the issue is local.
- Articles needing attention: negative articles from influential outlets, data errors, or unanswered requests for comment.
- Recommendations: two or three clear actions, each with an owner.
- Appendix: the full list of articles with headline, outlet, date, sentiment, and link.
A filled-in example
The example below is an illustration for an agency that manages clean water services. The numbers are made up for the example and are not real data.

|
Section |
Example content |
|---|---|
|
Summary |
Coverage rose to 1.6 times the average because of water outages in two districts. Most negative articles came from resident complaints. The agency's explanation appeared in only 4 of 18 outage articles. |
|
Key numbers |
46 articles from 31 outlets; 12 positive, 15 neutral, 19 negative (41%); previous seven-day average of 29 articles a day |
|
Issue 1 |
Water outage in districts A and B: 18 articles, 14 negative. Residents complain there is no recovery schedule yet. |
|
Issue 2 |
Planned tariff adjustment: 9 articles, 3 negative. Legislators ask for the study to be published. |
|
Issue 3 |
New connection program for low-income households: 7 articles, all positive or neutral. |
|
Needs attention |
Two regional outlets asked for the recovery schedule yesterday afternoon and have not received an answer. |
|
Recommendations |
Announce the recovery schedule and water distribution points this morning (PR and distribution unit). Answer both requests for comment before 10:00. Prepare a summary of the tariff study for the media. |
Column template for the article appendix
The appendix is where every article is recorded. Use the same columns every day so they can be combined into weekly and monthly reports. The same columns work for media clipping.
|
Column |
Content |
Example |
|---|---|---|
|
Publication date and time |
When the article went live |
12/11/2026 06:40 |
|
Outlet |
Outlet name and domain |
Regional Outlet X |
|
Headline |
The headline exactly as published |
Two Days Without Water, District A Residents Complain |
|
Issue |
Issue group |
Service disruption |
|
Region |
Province, district or city, subdistrict |
District A |
|
Sentiment |
Positive, neutral, negative |
Negative |
|
Sources quoted |
Who is quoted |
Residents, a legislator |
|
Agency explanation included? |
Yes or no |
No |
|
Link |
Article URL |
https://... |
The "agency explanation included?" column is often forgotten, but it is the most useful. It shows how many negative articles are circulating without your side of the story.
How to prepare a daily report in 30 minutes
- Pull data at 06:30: collect all articles from the last 24 hours for your agreed keywords.
- Clean it: remove irrelevant articles and merge duplicate headlines from the same outlet.
- Compare with the usual pattern: divide today's count by the previous seven-day average. A ratio above 1.3 deserves a mention in the summary. See how to read news spikes.
- Group the issues: read the negative headlines and group them into the three biggest issues.
- Write the summary and recommendations last: once all numbers are in, write the three-sentence summary and two or three actions.
- Send before 07:30: by email or message, with the article list as a separate attachment.
Common mistakes in daily reports
- Too long. If it runs past one page, leaders stop reading.
- Numbers without meaning. "46 articles" means nothing without a comparison.
- No recommendations. A report without actions is just an archive.
- Treating every article as equally important. Separate articles that need a response from routine ones.
- Relying on sentiment labels without checking. Negative articles mentioned in the summary should be read directly. See sentiment analysis in Bahasa Indonesia.
Automated daily reports with Qola
Preparing a daily report by hand takes time every morning. In Qola, national and regional online news is collected and labeled for sentiment automatically, spikes are flagged early, and reports can be produced as PDF, Excel, or infographics. The PR team only needs to review, add recommendations, and send. See solutions for government PR or contact us.
FAQ: daily media monitoring reports
What does a daily media monitoring report contain?
A header, a three-sentence summary, key numbers (articles, outlets, and sentiment), the top three issues, regions, articles needing attention, recommended actions, and an appendix listing the articles.
How long should a daily media monitoring report be?
One page for the main content. Put the full list of articles in a separate appendix.
What time should a daily report be sent?
Before working hours start, for example at 07:30, covering the previous 24 hours. That way actions can be decided the same morning.
What is the difference between a daily and a monthly report?
A daily report focuses on new issues and today's actions. A monthly report focuses on trends, comparisons, and program evaluation.
Which columns should the article list include?
Publication date and time, outlet, headline, issue, region, sentiment, sources quoted, whether the agency's explanation is included, and the link.